Thank you for your question, Stephen.V – we happened to be busy with a self-driven build when you enquired regarding a way to easily analyze the public datasets that AWS had made available.
Of course, standard query and analysis of the public datasets is easily achievable by following the instructions in this blog: https://aws.amazon.com/blogs/big-data/a-public-data-lake-for-analysis-of-covid-19-data/
However, we really wanted to expand a little on this basis, to form a simple data & analytics foundation with basic capabilities, including the ability to enrich or transform the source data. Here we also wanted to explore virtualization through a more powerful analytical query engine before delivering those aggregate insights for further analysis and visualization.
Lastly, we were quite eager to explore AWS Lake Formation – this has literally been on the backlog for weeks! (perhaps months!?) So this build presented an ideal opportunity to explore Lake Formation as a potential accelerator.
– the solution
What we’ll do, is a fly-over of the foundation environment, following the data flow, elaborating a little on our thoughts and the build process along the way.
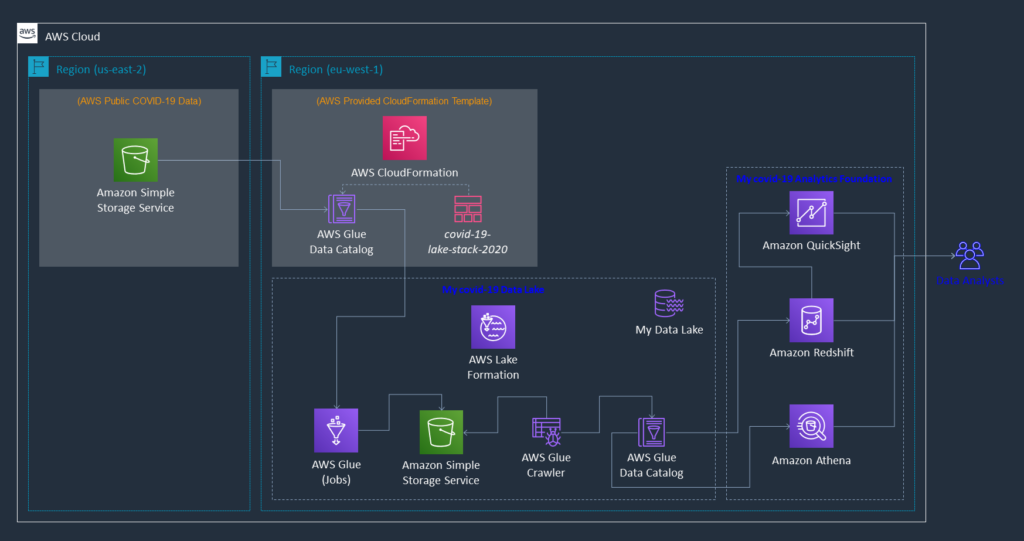
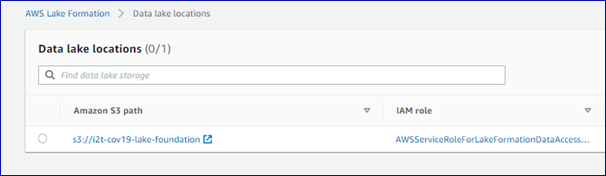
As a logical starting point – because this use case really started with a source dataset – we have this data in North America, and with most of our analysts in EMEA. Thus we used AWS Lake Formation to establish the basic foundations of our data lake in eu-west-1.
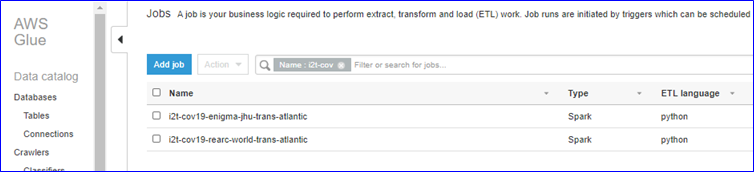
Next, we simply used AWS Glue Jobs, along with the AWS CloudFormation template, to move the source data across the Atlantic and into our local S3 Covid-19 data lake.
The two tables we chose for our example took around 45-60 seconds each to execute – this includes sourcing the data from S3 in North America, transforming the JSON format into Parquet and landing it on S3 in Europe.
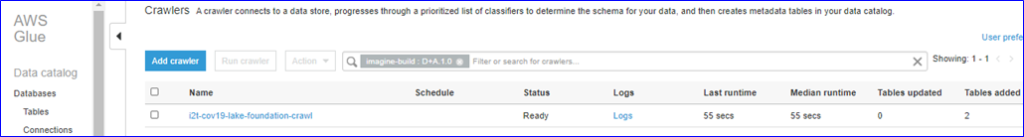
We then created an AWS Glue Crawler to discover the metadata of our newly formed data lake & update our new AWS Glue Data Catalog – theoretically, we could also create the new tables in our Data Catalog based upon the metadata provided in the AWS CloudFormation template, but we’ve selected to showcase the Crawler capability instead.
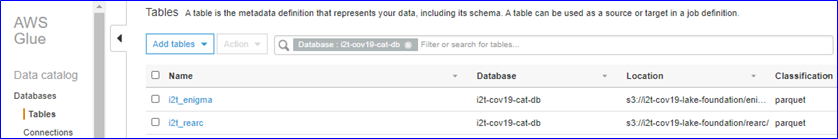
At this point, we really have our data foundations in place, and our analysts can already start interacting with our data lake by means of Amazon Athena, which leverages the Data Catalog and enables SQL query and analysis.
Now the fun really starts though! Once we’ve spun up our Amazon Redshift cluster, enabled the necessary Redshift Spectrum permissions and created our external schema with the magic keywords from data catalog, our data lake gets dynamically exposed into our Redshift database! (worthy to note here, that Spectrum cannot cross regions – e.g. our external schema in eu-west-1 couldn’t point to the public data lake in us-east-2)
Amazon Redshift is an extremely powerful MPP, In-Mem Columnar Store fully managed service. In this specific instance, Redshift provides us full functions and procedural coding capabilities (PL/pgSQL), along with the obvious SQL base, offering us the ability to do pretty much any calculations, aggregations, transformations or other enrichments on our data.
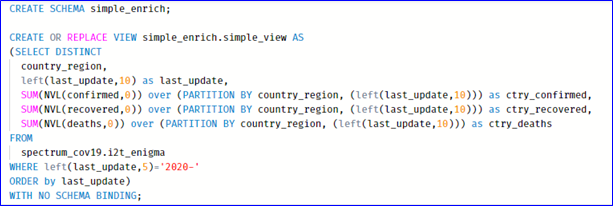
For our purposes, we’ve just built a simple view on top of our Spectrum external table to do a few small example transformations and enrichments.
Note that we’re not physically persisting any data in Redshift, but merely leveraging its virtualization and in-flight capabilities.
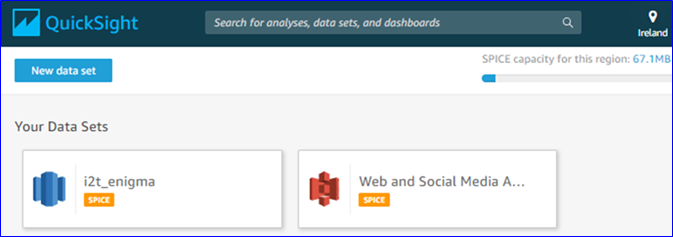
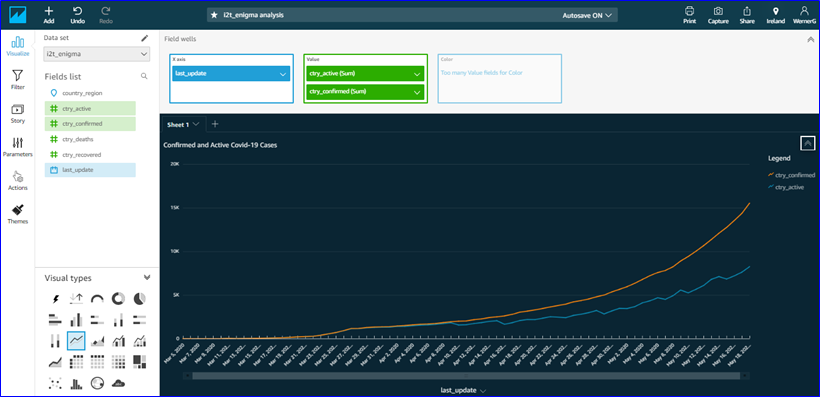
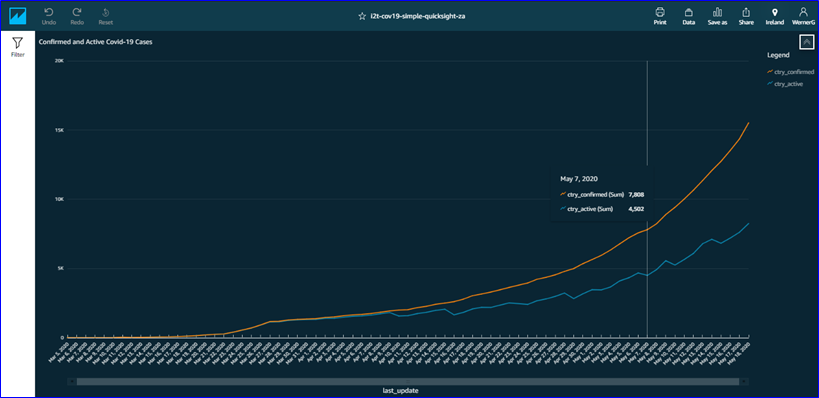
Lastly, we’ve hooked up Amazon QuickSight to our Redshift cluster, added another in-flight measure (active cases), and visualized our own Covid-19 curves within minutes!
Our analysts now have a basic data and analytics foundation available, from where we can support them and further mature these capabilities.
– lessons learnt
When it comes to lessons learnt, we’d have to mention that the connectivity between QuickSight and Redshift needed a little extra attention in terms of defining explicit Security Group rules. It is documented in the product pages, but not that clear from the console pages, so just keep it in mind.
Obviously, discovery and analysis is always important, which is why we’ve decided to create the calculated metric – brief analysis of the source data highlighted potential anomalies in the provided column, so we decided to calculate using the base measures instead.
– conclusion
Using the publicly available dataset, we have illustrated how to build the basic foundations of your own data lake. In a few more steps, we’ve also illustrated how to further expand that into a simple data and analytics foundation with basic capabilities.
Additional exploration around this design, would certainly have to include an investigation into more advanced in-flight enrichments – where would that be optimally positioned in this flow (Redshift / QuickSight SPICE)?
And next, of course, we already imagine immediately maturing this foundation to accommodate real-time data feeds and perhaps machine learning foundations?…